前言
- 写了几万行代码,提了几千个PR,上线部署之后发现
- CPU占用高?内存占用高?WTF
- 这个时候就需要加上性能分析工具,快速定位问题所在
工具介绍
- 想要进行性能优化,首先瞩目在 Go 自身提供的工具链来作为分析依据,涉及如下:
- net/http/pprof:采集 HTTP Server 的运行时数据进行分析
- runtime/pprof:采集程序(非 Server)的运行数据进行分析
- 因为我主要是做服务器开发,因此我只将来第一种
HTTP Server
简单的demo
1 | package main |
- 运行这个文件,你的 HTTP 服务会多出 /debug/pprof 的 endpoint 可用于观察应用程序的情况
分析
通过Web界面
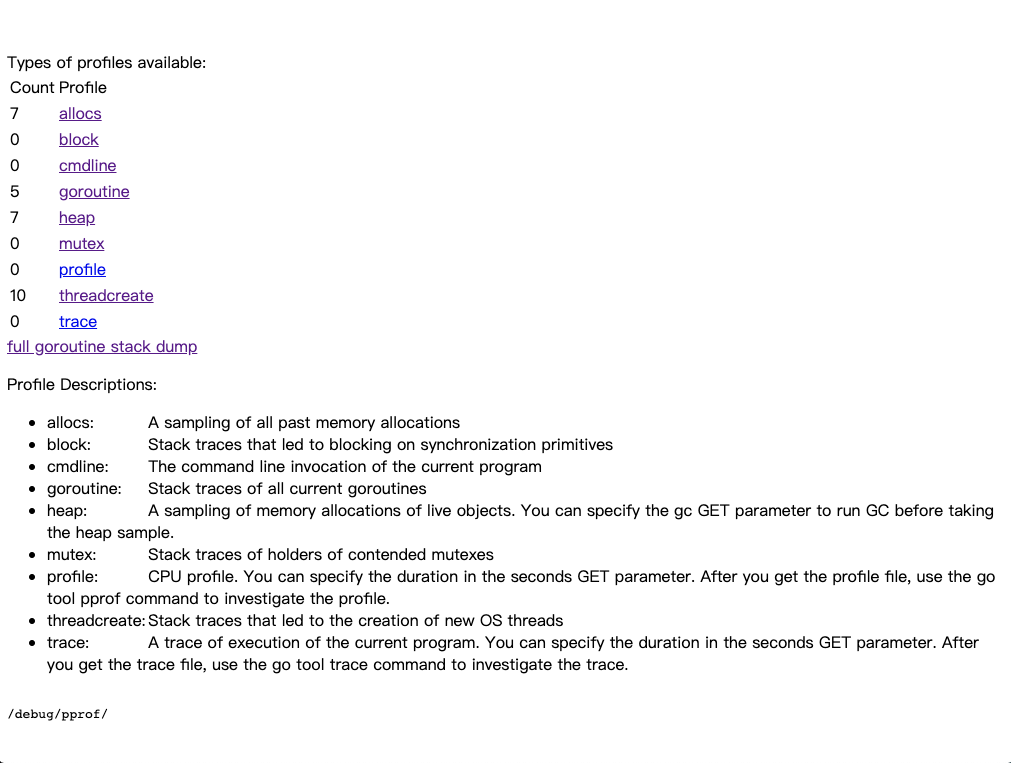
- 访问 http://127.0.0.1:6060/debug/pprof/, 查看你的 HTTP Server 的运行情况

- 下面有对每一个采集的解释,我来提及几个重要的指标
- profile:CPU使用情况的采集,默认进行30s的 CPU Profiling,得到一个用于分析的profile文件,如何分析后文会继续叙述。
- goroutine:goroutine分析,可以看出 goroutine 的总量以及每个 goroutine 的具体执行代码
- mutex:导致互斥锁的竞争持有者的堆栈跟踪
通过交互式终端
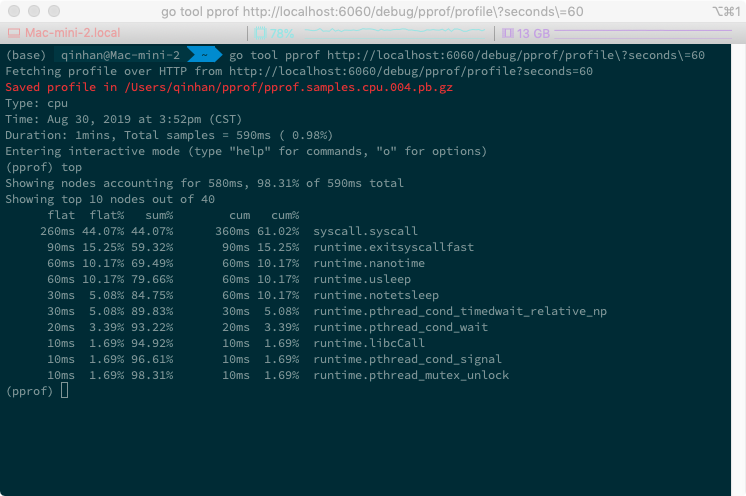
go tool pprof http://localhost:6060/debug/pprof/profile?seconds=60
该命令会采集60s的CPU使用情况,结束后进入交互命令模式,可以对采集的结果进行查看/直接导出。

列项 描述 flat 给定函数上运行耗时 flat% 同上的 CPU 运行耗时总比例 sum% 给定函数累积使用 CPU 总比例 cum 当前函数加上它之上的调用运行总耗时 cum% 同上的 CPU 运行耗时总比例
go tool pprof http://localhost:6060/debug/pprof/heap
go tool pprof http://localhost:6060/debug/pprof/block
go tool pprof http://localhost:6060/debug/pprof/mutex
- 上述三项的用法和前面所述的第一个的使用相类似,只不过采集的对象不同
PProf 可视化界面
- 在第一中分析方法
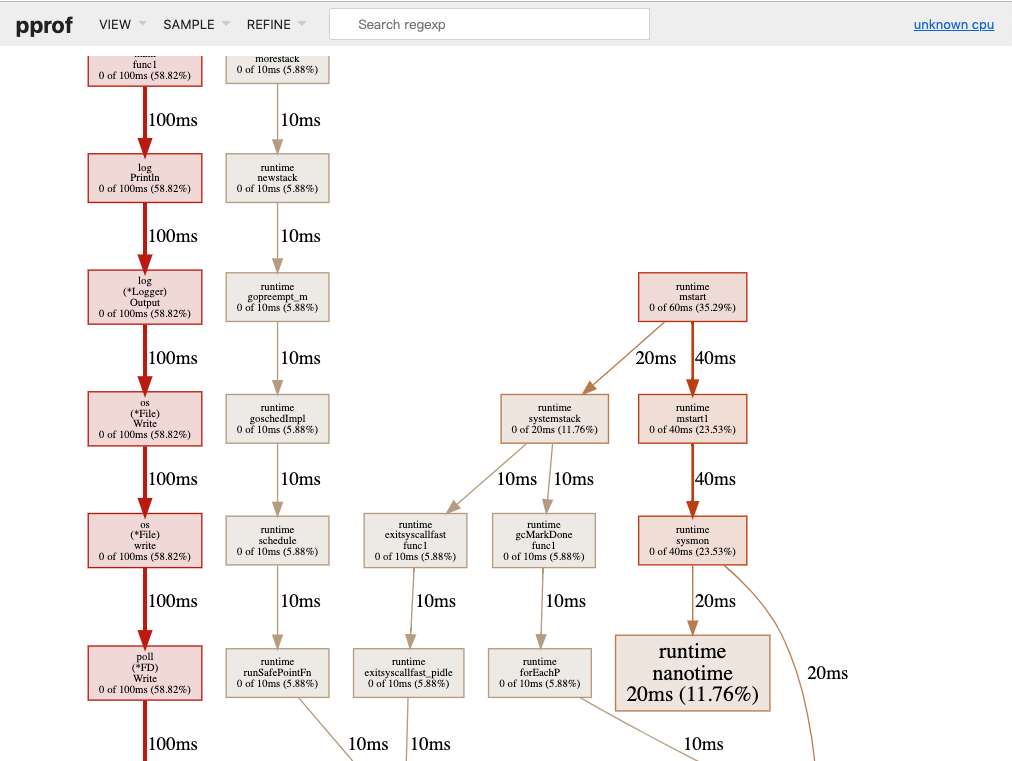
通过Web界面下载到的文件可以通过可视化的界面来进行分析 - 或者在第二种分析方法中,进入交互界面之后,输入
web也是可以进入图形界面的哦 - 具体的方法如下所示:
1
go tool pprof -http=:8080 cpu.prof

- 这样即可在 localhost:8080 中即可访问

- 如果出现 Could not execute dot; may need to install graphviz.,就是提示你要安装 graphviz


